
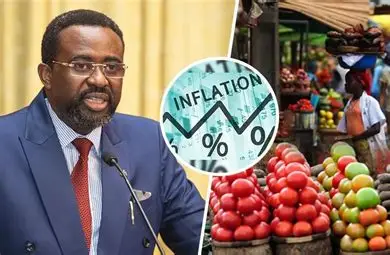

Ghana’s year-on-year inflation rate declined further to 4.6 per cent in July 2026, down from 5.3 per cent in June, as easing food prices continued to drive down overall consumer price growth.
The latest Consumer Price Index (CPI) data released by the Ghana Statistical Service (GSS) shows inflation fell by 0.7 percentage points from the previous month and by 7.5 percentage points from the 12.1 per cent recorded in July 2025, signalling a sustained improvement in price stability.
Government Statistician, Dr Alhassan Iddrisu, said while prices continue to increase, they are doing so at a much slower pace than a year ago, reflecting continued moderation in inflationary pressures.
On a month-on-month basis, inflation slowed further to 0.1 per cent in July from 0.2 per cent in June, suggesting consumer prices were almost unchanged during the month.
The Consumer Price Index also increased to 271.1 in July, up from 259.1 in June, reflecting changes in the overall price level based on the 2021 CPI basket.
Food prices continue to provide relief.
Food inflation remained the main factor behind the decline in headline inflation.
Year-on-year food inflation eased to 3.1 per cent in July from 3.9 per cent in June, while month-on-month food inflation fell to -0.1 percent, indicating that average food prices declined slightly during the month.
The GSS described the development as evidence that “food relief is real,” noting that slowing food inflation is easing pressure on household shopping baskets.
Among the products recording the biggest price declines over the past year were kontomire (cocoyam leaves), whose average price dropped by 41.2 percent, garden eggs (34.5%), maize (32.9%), pawpaw (26.8%), millet (26.4%), guinea corn/sorghum (22.3%), beans (20.6%), lime (19.8%), local rice (16.0%), and Bambara beans (15.7%).
Ginger, tomatoes and mangoes record biggest price increases
Despite the easing in overall food inflation, several products experienced significant price increases during the period.
According to the GSS, ginger more than doubled in price, recording the highest annual increase of 111.3 per cent.
Other products registering substantial increases included mangoes (89.0%), shrimps (67.1%), bananas (45.9%), fresh tomatoes (43.4%), fresh coconut (39.2%), avocado pear (32.9%), palm fruits (32.7%), cashew (29.1%), as well as parking space and related services (28.3%).
The Statistical Service noted that the national inflation figure masks significant differences across individual products, with some items becoming considerably cheaper while others experienced sharp price increases.
Non-food items remain the biggest inflation driver
Although food inflation continued to decline, non-food inflation remained comparatively elevated.
The year-on-year non-food inflation rate eased slightly to 6.1 per cent from 6.3 per cent in June.
The GSS said non-food items accounted for 67.6 per cent of total inflation in July, meaning that for every GH¢1 increase in prices, approximately 68 pesewas came from non-food goods and services.
These include transport, housing, rent, education, health services, insurance, and other services.
Every month, non-food inflation increased marginally to 0.5 per cent from 0.4 per cent in June.
Services remain the last hurdle.
The Statistical Service described services as “the last hurdle” in Ghana’s fight against inflation.
Services inflation slowed from 9.4 per cent in June to 8.5 percent in July but remained the highest among all major CPI divisions.
According to the GSS, transport costs, rents, healthcare and school fees continue to be among the stickiest components of inflation.
The biggest contributors to overall inflation during the month were:
* Payment for rents – 13.0%
* Fresh tomatoes – 11.9%
* Ginger – 11.8%
* Cooked rice – 8.9%
* River fish – 6.2%
* Charcoal – 6.1%
* Public and private senior high school fees – 5.4%
* Bus and trotro fares – 5.4%
* Hotel accommodation – 3.8%
* Electricity – 3.7%
These categories continued to exert upward pressure on household expenditure despite the broader decline in inflation.
Locally produced goods dominate inflation.
Inflation for locally produced goods continued to outpace imported products.
Year-on-year inflation for locally produced items slowed from 6.7 per cent in June to 5.9 per cent in July, while inflation for imported goods eased from 2.3 percent to 2.0 percent.
The GSS noted that locally produced items account for about 86.7 per cent of overall inflation, highlighting that current inflationary pressures are largely domestic rather than imported.
Every month, locally produced goods recorded inflation of 0.1 per cent, compared with 0.6 per cent in June, while imported goods recorded -0.1 percent, compared with -0.5 percent the previous month.
Regional differences remain significant.
Inflation continued to vary widely across the country.
The North East Region recorded the highest year-on-year inflation rate at 10.8 per cent, more than double the national average.
In contrast, the Bono East Region recorded the lowest inflation rate at -3.8 per cent, indicating that average consumer prices were lower than they were a year earlier.
The GSS noted that where people live still matters, as the cost of living differs significantly across regions.
Outlook
The July inflation data reinforce Ghana’s progress in restoring price stability after a prolonged period of high inflation.
Headline inflation has now more than halved over the past year, falling from 12.1 per cent in July 2025 to 4.6 per cent in July 2026. While food prices are providing increasing relief to households and overall price increases have slowed to almost zero every month, the latest figures suggest policymakers will continue to monitor persistent inflation in services, particularly rents, transport, education and healthcare, which remain the most significant sources of cost pressures for consumers.